โ† Back to Portfolio

๐Ÿ“ฑ Telecom Customer Churn Analysis

Complete 4-Page Power BI Dashboard

๐Ÿ“‹ All 4 Dashboard Pages

Executive Overview

Page 1: Executive Overview

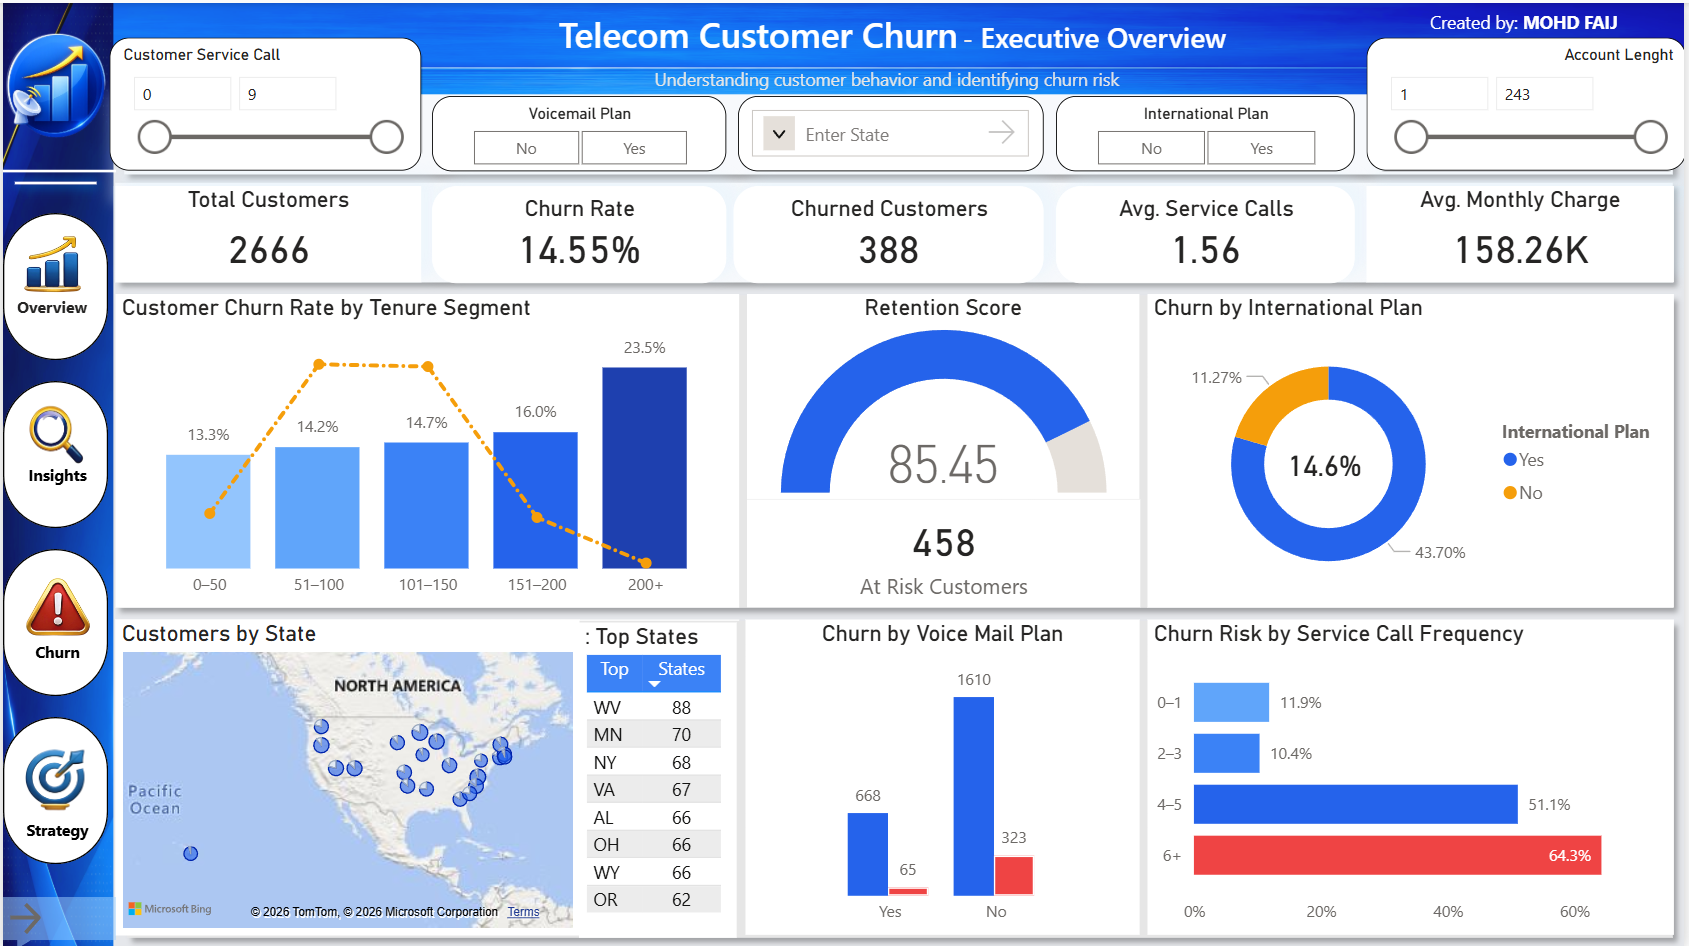
High-level KPIs, churn rate trends, and overall performance metrics

Customer Insights

Page 2: Customer Insights

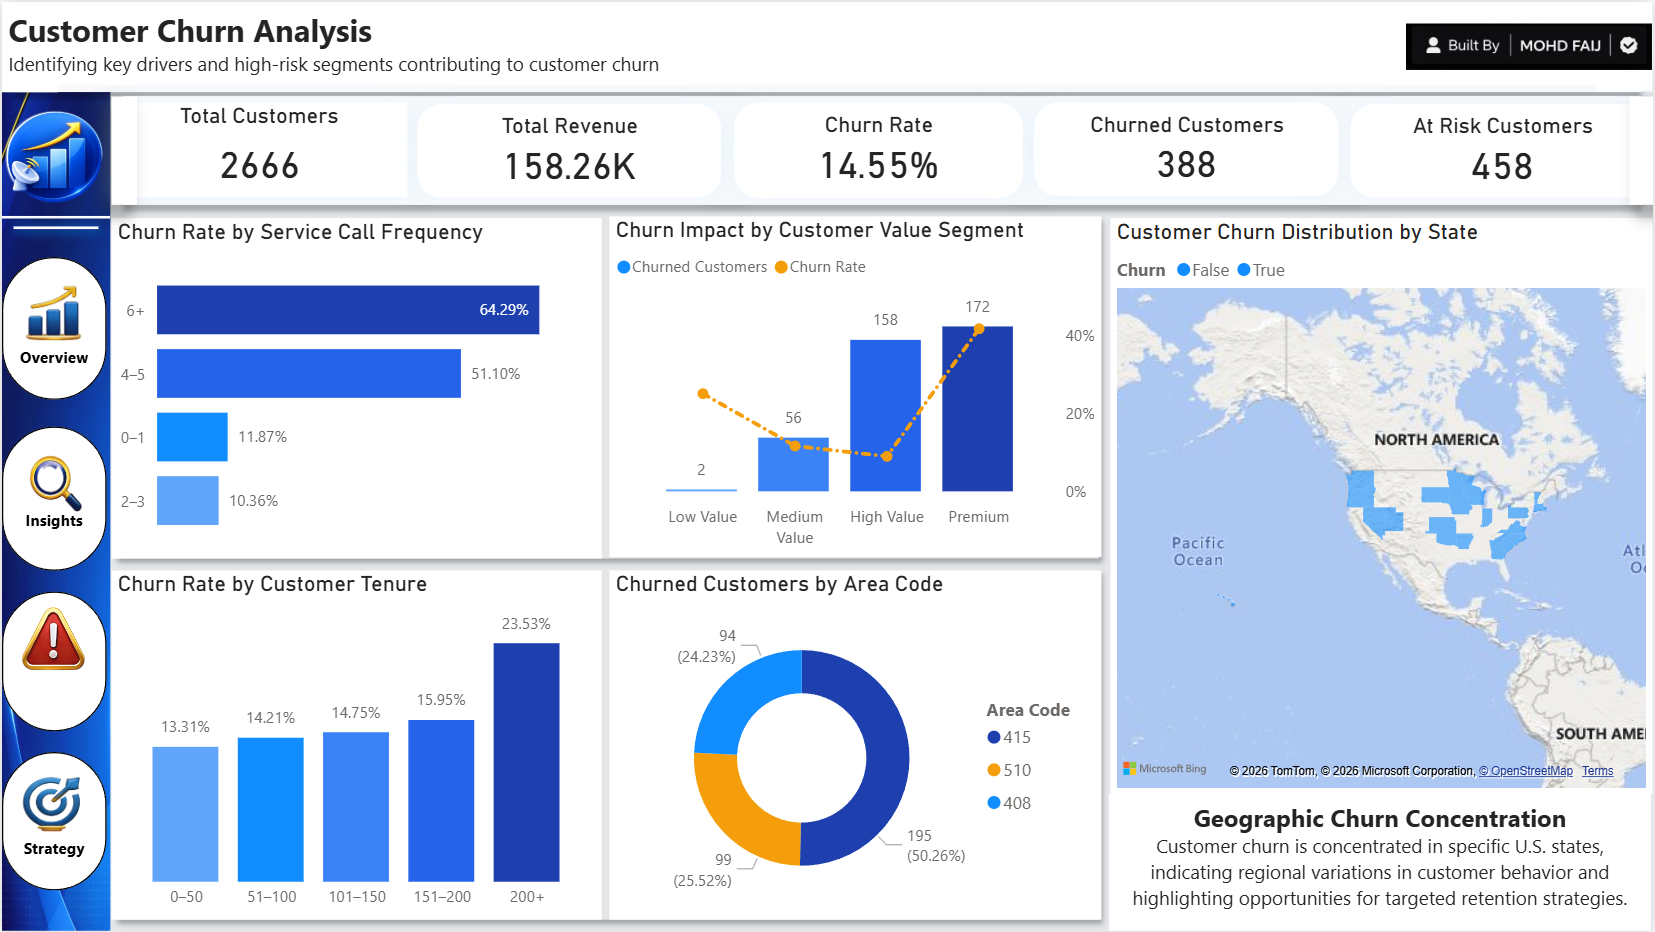
Demographic analysis and behavior patterns of churned customers

churn Analysis

Page 3: Revenue Analysis

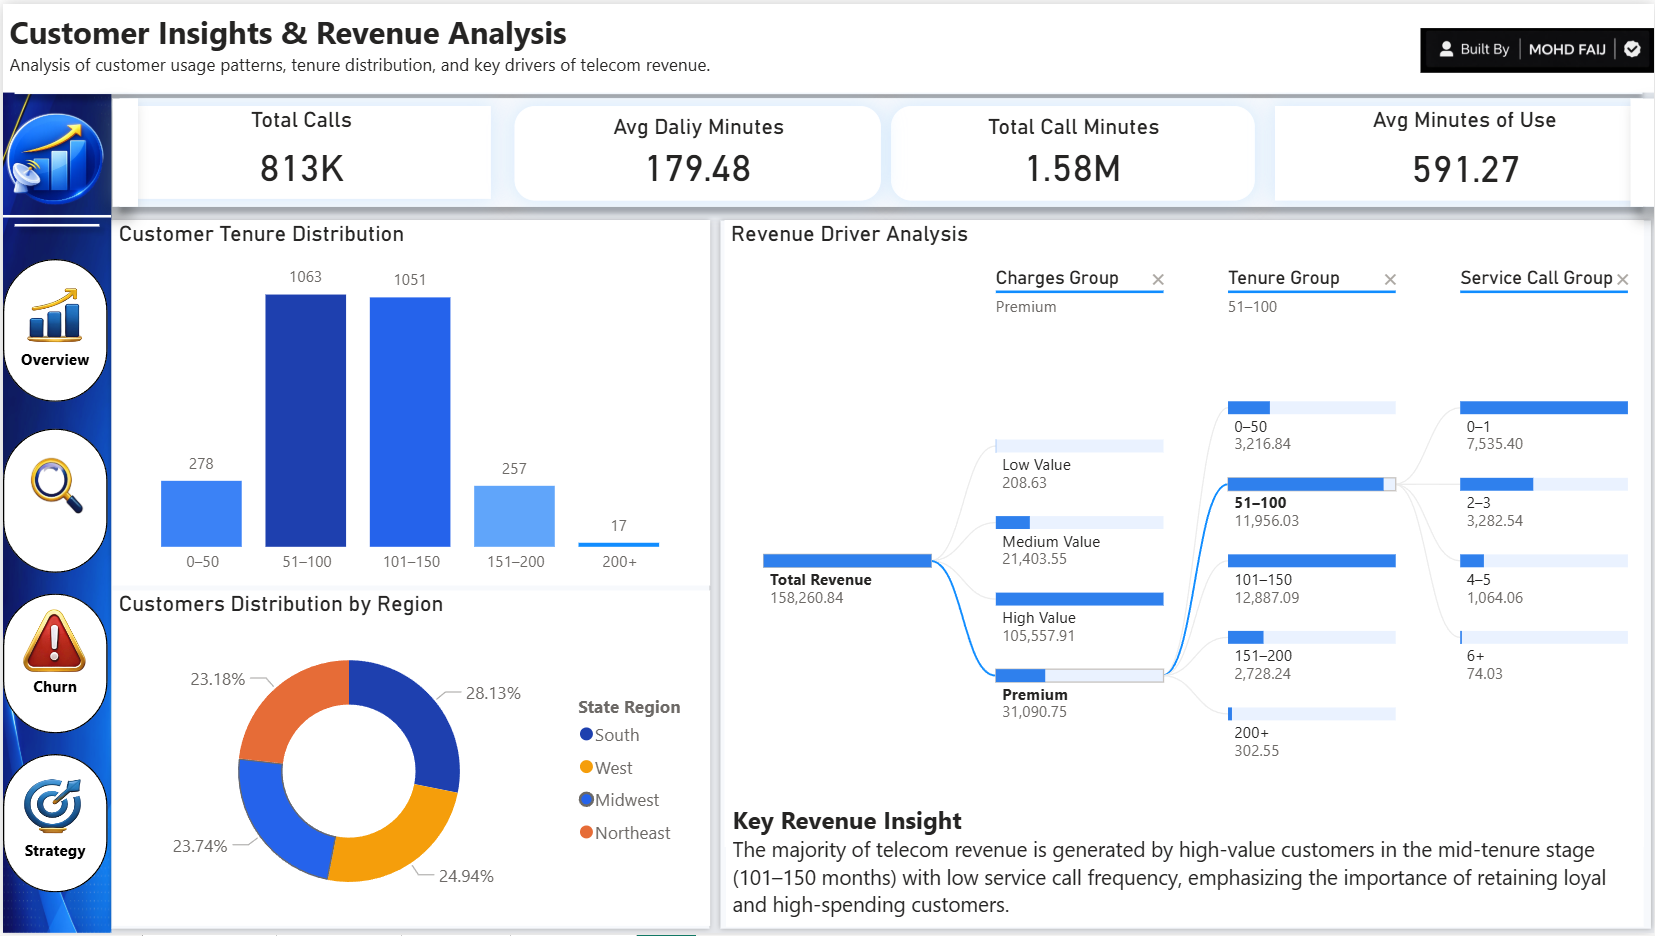
Revenue impact of churn and at-risk revenue analysis

Retention Strategies

Page 4: Retention Strategies

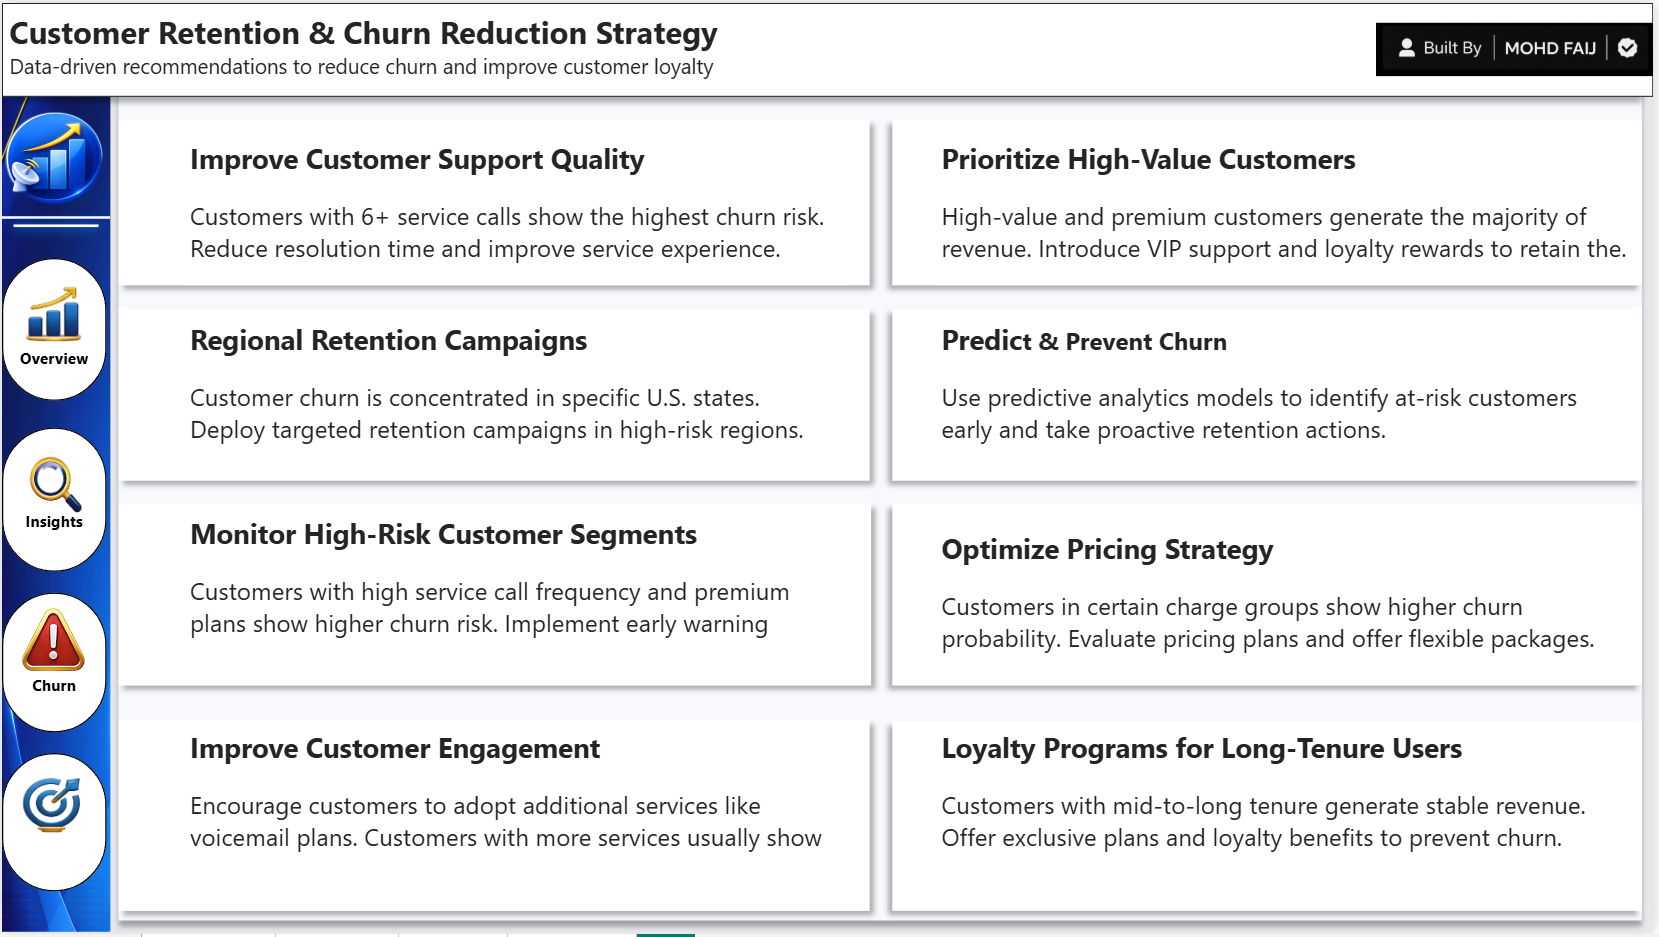
Actionable insights and recommended retention campaigns

๐Ÿ”‘ Key Insights

Total Customers: 2,666
Churn Rate: 14.55%
Churned Customers: 388
At-Risk Customers: 458
Avg Monthly Charge: 158.26K
Avg Service Calls: 1.56
Retention Score: 85.45%
Top State: WY (88)
Tools Used
Power BI DAX SQL Data Modeling Excel Power Query
Key Features
Customer churn prediction
Customer segmentation analysis
Revenue impact assessment
Geographic churn patterns
Service call frequency analysis
Voicemail & international plan impact
Tenure-based churn trends
Retention strategy recommendations