โ† Back to Portfolio

๐Ÿ“Š Enterprise Sales Dashboard

Comprehensive sales analytics with revenue tracking and profit margin analysis

$21.42M
Total Revenue
$5.53M
Total Profit
25.82%
Profit Margin
$10.71K
Avg Order Value
Enterprise Sales Dashboard
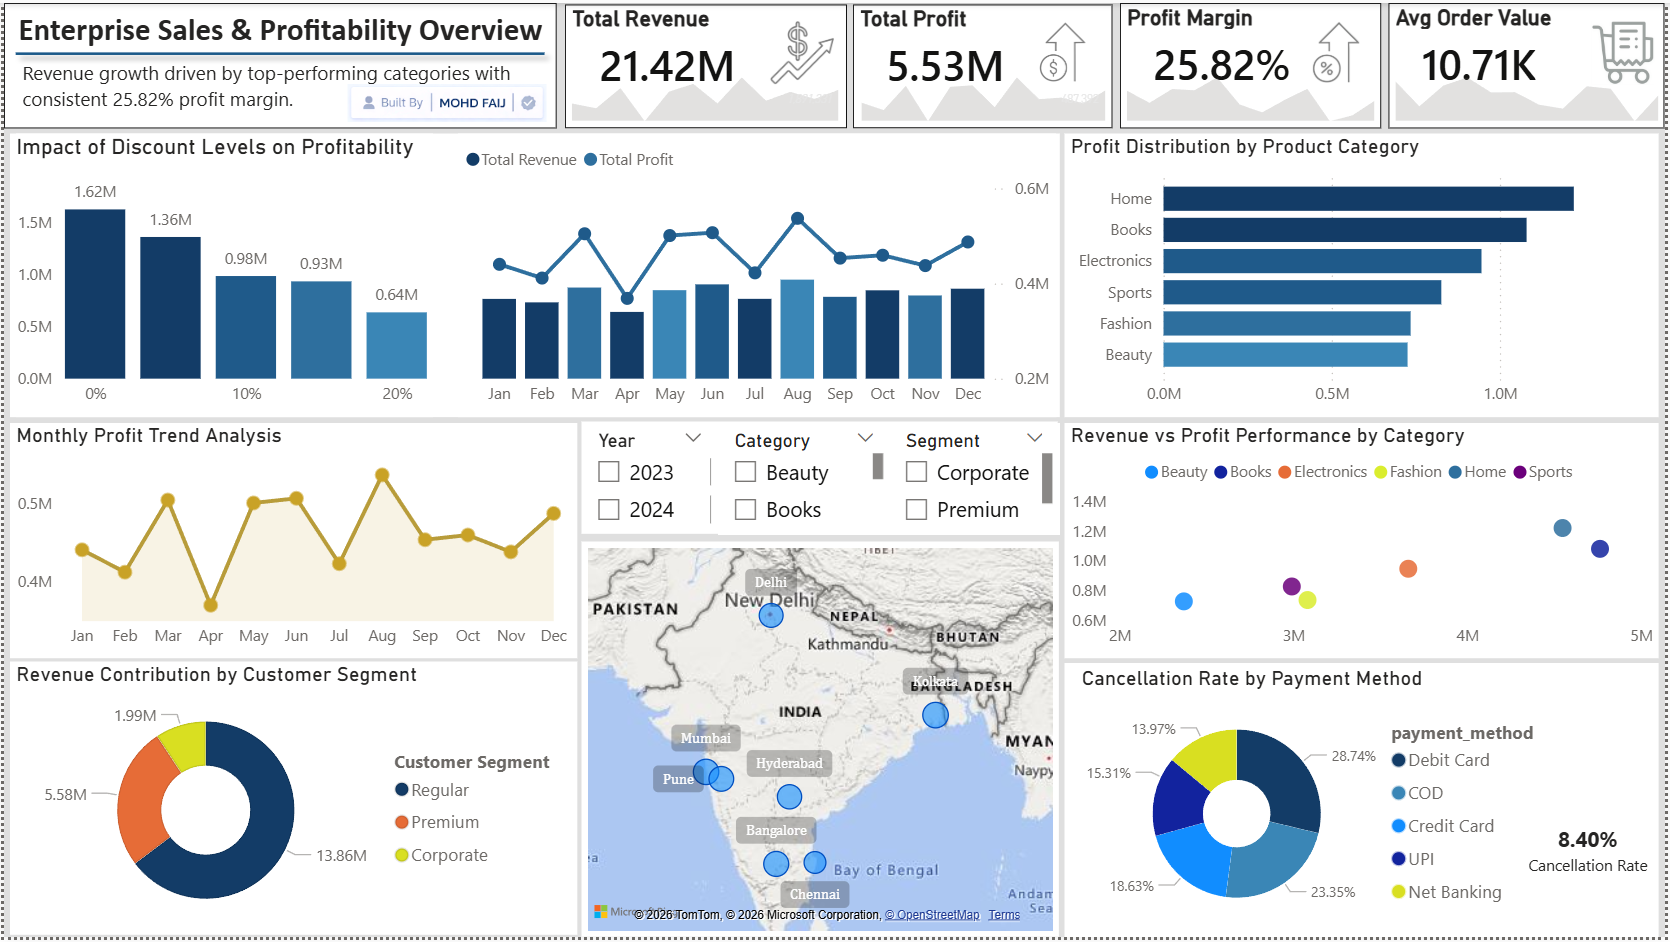
Monthly Profit Trend Analysis
Jan
$440.41K
Feb
$411.51K
Mar
$504.66K
Apr
$368.79K
May
$500.90K
Jun
$506.90K
Jul
$422.48K
Aug
$537.15K
Sep
$453.42K
Oct
$459.49K
Nov
$437.71K
Dec
$487.39K
Revenue vs Profit by Category
Beauty
$0.7M
$2.37M
Books
$1.08M
$4.76M
Electronics
$0.9M
$3.66M
Sports
$0.8M
$2.99M
Fashion
$0.7M
$3.08M
Other
$1.98M
$4.56M
Revenue by Customer Segment
Regular
65%
$13.86M
Premium
26%
$5.88M
Corporate
9%
$1.99M
Cancellation Rate by Payment Method
Debit Card
28.74%
COD
23.35%
Credit Card
18.63%
UPI
15.31%
Net Banking
13.97%
Overall Cancellation Rate: 8.40%
Tools Used
Power BI DAX SQL Data Modeling Excel Power Query
Key Features
Dynamic revenue forecasting
Product category analysis
Regional sales breakdown
YoY growth tracking
Profit margin analytics
Customer segment analysis
Discount impact analysis
Monthly profit trends