Amazon India Dataset
🛒 E-Commerce Sales Intelligence Dashboard
₹78.6M
Total Revenue
120K+
Total Orders
32.78%
Profit Margin
42.22%
ROI
14.21%
Cancellation Rate
₹609
Avg Order Value
📸 Dashboard Gallery (Click any image to zoom)
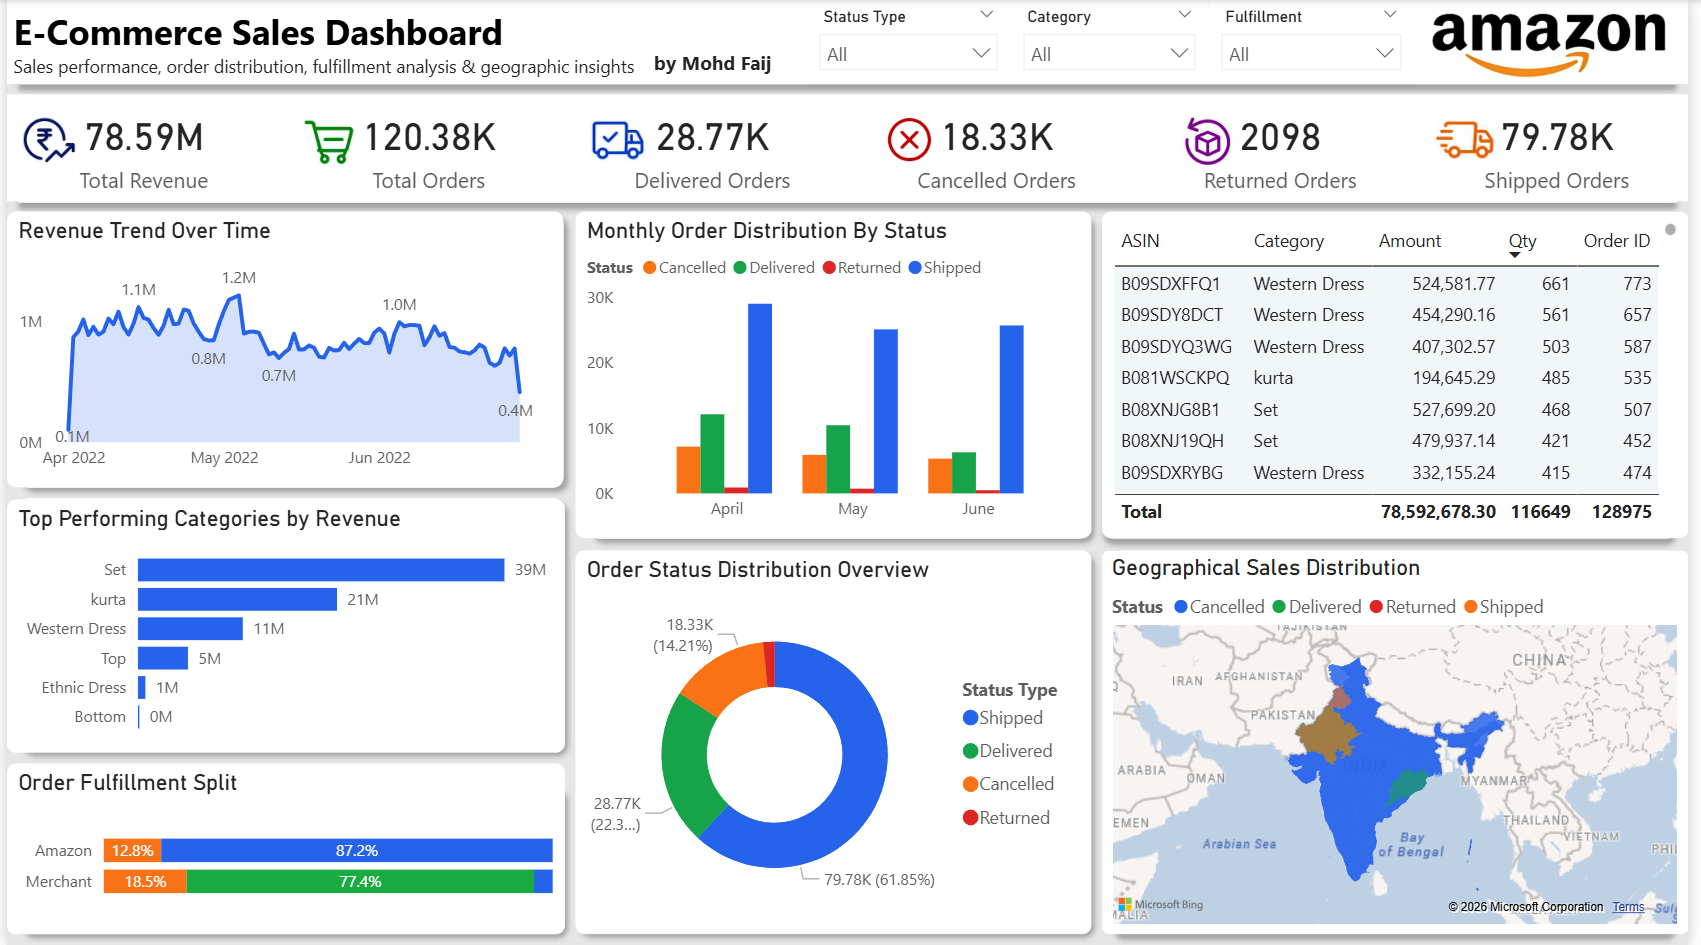
Page 1: Sales Overview – Revenue, Orders & Geography
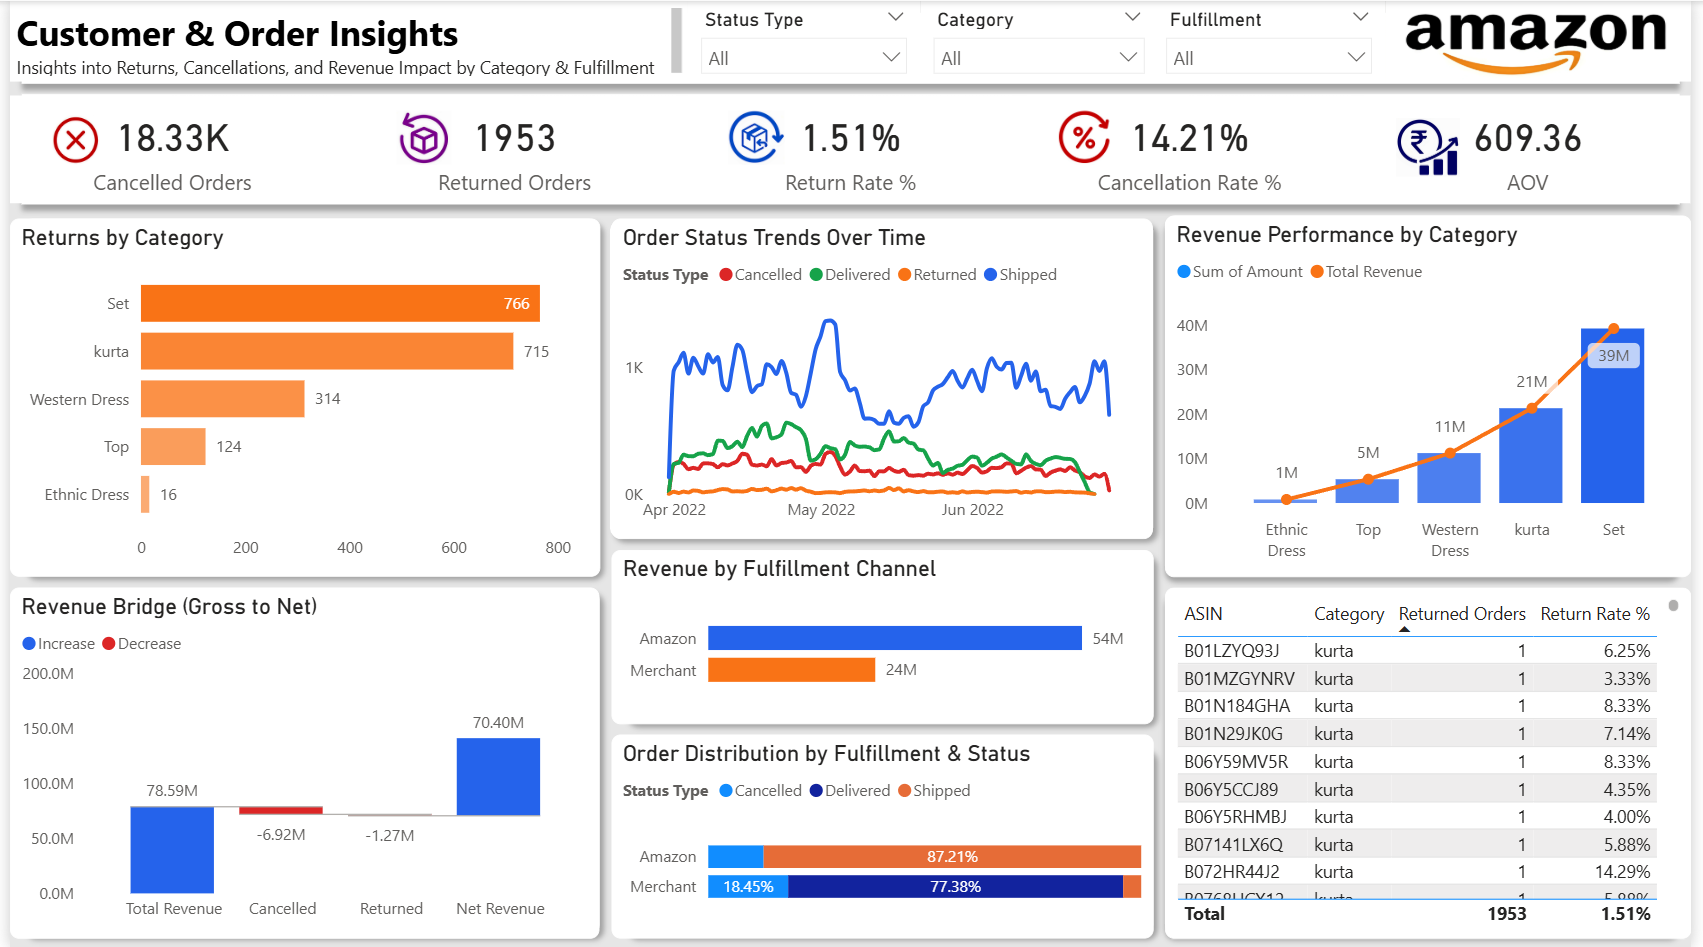
Page 2: Customer Insights – Returns, Cancellations & Fulfilment
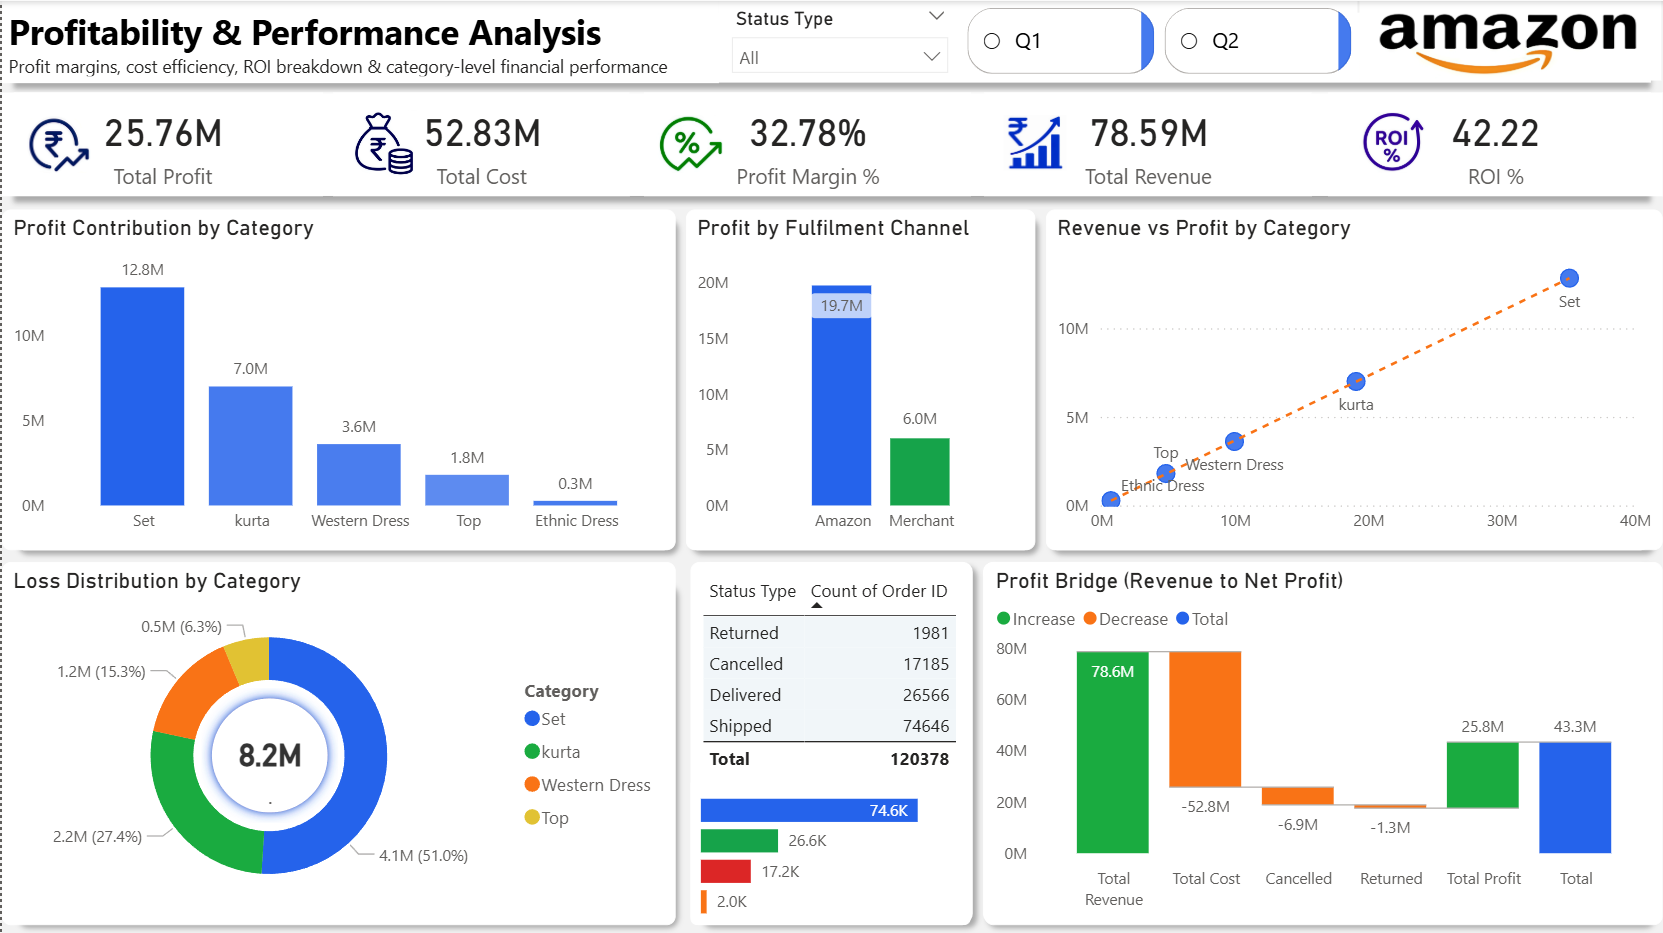
Page 3: Profitability – Margins, ROI & Profit Bridge
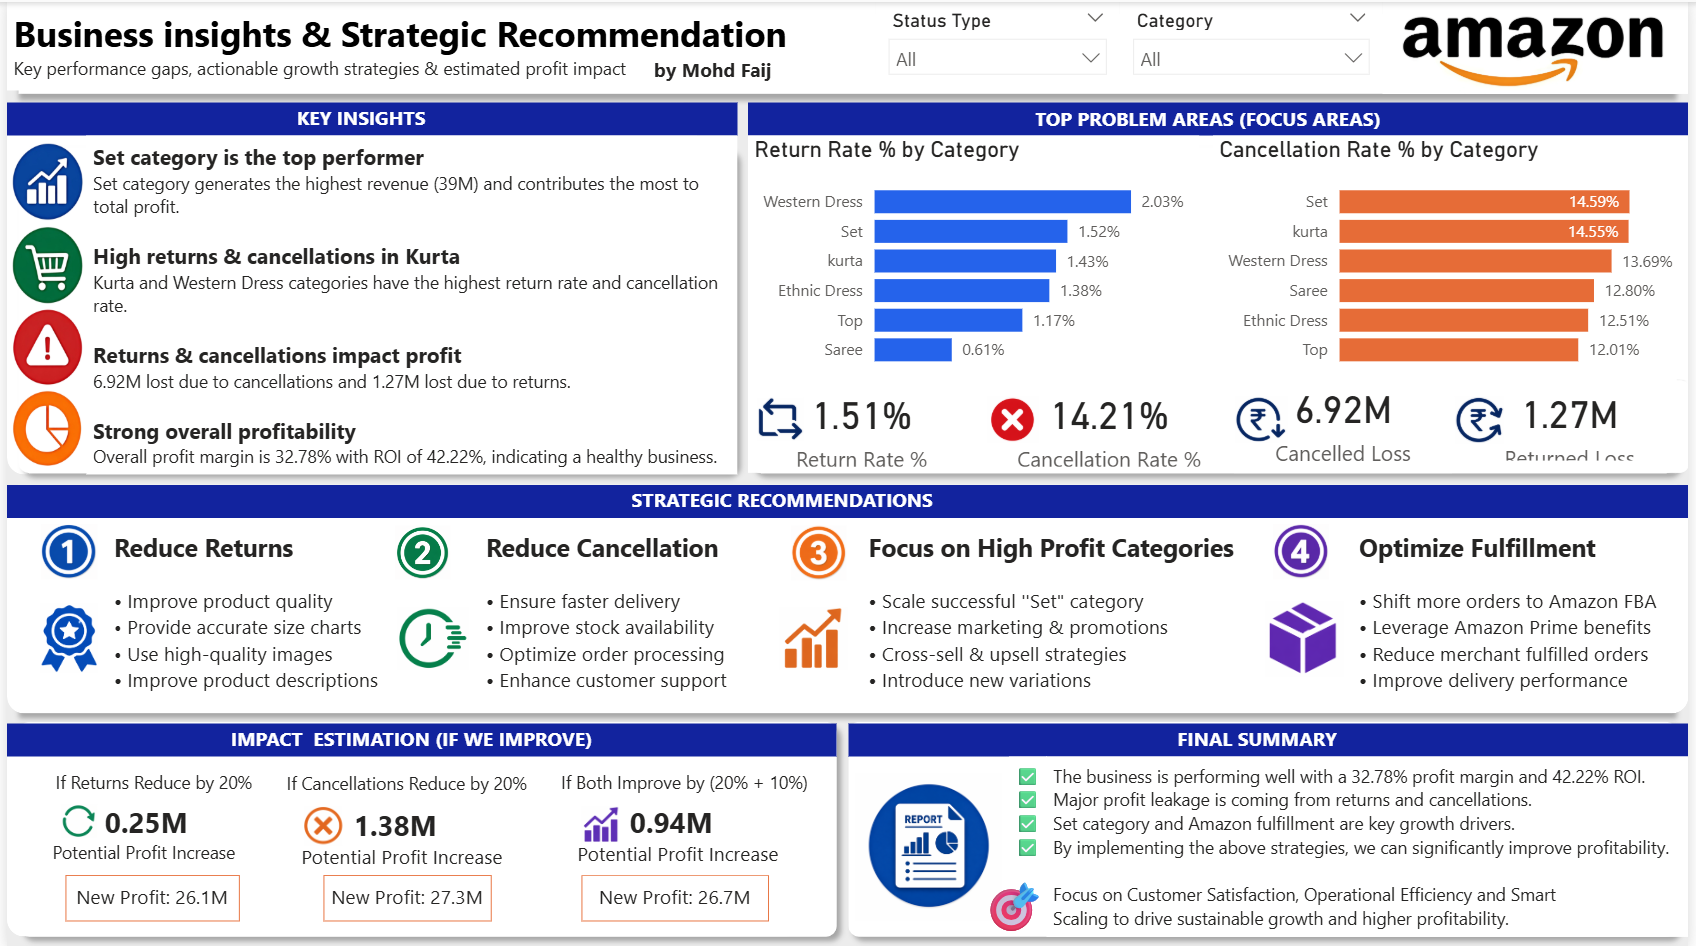
Page 4: Strategy – Insights, Problem Areas & Recommendations
The Insight That Changed Everything
The Set category drives 39M in revenue — yet carries a 14.59% cancellation rate, the highest of any category. The very products generating the most revenue are simultaneously creating the most financial leakage.
This revealed a core tension: scaling the top category without fixing its fulfilment & quality gaps would be a losing strategy, eroding profit even as revenue grows.
🔍 Key Data-Driven Insights
- Set category dominates: ₹39M revenue, ₹12.8M profit — largest contributor across all metrics
- ₹8.2M total loss from returns & cancellations — Set (51%) and Kurta (27.4%) responsible for most of it
- Amazon FBA outperforms Merchant: ₹19.7M vs ₹6M profit; 87.2% vs 77.4% delivery success rate
- Revenue decline trend: Monthly revenue dropped from ₹1.2M peak (May 2022) to ₹0.4M by late June 2022
- Western Dress: highest return rate at 2.03% — driven by sizing & quality mismatches
- Profit Bridge: ₹78.6M revenue → -₹52.8M cost → -₹6.9M cancellations → -₹1.3M returns → ₹25.8M net profit
- If cancellations reduce 20%: potential ₹1.38M additional profit; New profit: ₹27.3M
⚙️ Code & Technical Implementation
-- Revenue & order summary by category
SELECT
    Category,
    COUNT(OrderID)                                         AS TotalOrders,
    SUM(Amount)                                            AS TotalRevenue,
    SUM(CASE WHEN Status = 'Cancelled' THEN Amount ELSE 0 END) AS CancelledRevenue,
    SUM(CASE WHEN Status = 'Returned'  THEN Amount ELSE 0 END) AS ReturnedRevenue,
    ROUND(
        SUM(CASE WHEN Status = 'Cancelled' THEN 1.0 ELSE 0 END) / COUNT(*) * 100, 2
    ) AS CancellationRate
FROM Orders
GROUP BY Category
ORDER BY TotalRevenue DESC;

-- Monthly revenue trend
SELECT
    FORMAT(OrderDate, 'yyyy-MM') AS Month,
    SUM(Amount)                  AS MonthlyRevenue,
    COUNT(OrderID)               AS MonthlyOrders
FROM Orders
WHERE Status NOT IN ('Cancelled', 'Returned')
GROUP BY FORMAT(OrderDate, 'yyyy-MM')
ORDER BY Month;
# Cancellation & return rate heatmap by category
import pandas as pd
import seaborn as sns
import matplotlib.pyplot as plt
pivot = df.pivot_table(
values='OrderID', index='Category',
columns='Status', aggfunc='count', fill_value=0
)
pivot['CancellationRate'] = pivot['Cancelled'] / pivot.sum(axis=1) * 100
pivot['ReturnRate'] = pivot['Returned'] / pivot.sum(axis=1) * 100
sns.heatmap(pivot[['CancellationRate', 'ReturnRate']],
annot=True, fmt='.1f', cmap='YlOrRd')
plt.title('Cancellation & Return Rate by Category')
plt.tight_layout()
plt.show()
# Revenue trend over time
df['OrderDate'] = pd.to_datetime(df['OrderDate'])
monthly = df[df['Status'] == 'Shipped'].groupby(
df['OrderDate'].dt.to_period('M')
)['Amount'].sum()
monthly.plot(kind='line', title='Monthly Revenue Trend',
color='#f97316', linewidth=2)
plt.ylabel('Revenue (₹)')
plt.show()// Total Profit
Total Profit = [Total Revenue] - [Total Cost] - [Cancelled Loss] - [Returned Loss]
// Profit Margin %
Profit Margin % = DIVIDE([Total Profit], [Total Revenue], 0) * 100
// ROI %
ROI % = DIVIDE([Total Profit], [Total Cost], 0) * 100
// Cancellation Rate %
Cancellation Rate % =
DIVIDE(
CALCULATE(COUNTROWS(Orders), Orders[Status] = "Cancelled"),
COUNTROWS(Orders)
) * 100
// Profit by Fulfillment Channel
Profit by Channel =
CALCULATE(
[Total Profit],
ALLEXCEPT(Orders, Orders[Fulfilment])
)
// Impact Simulation – If Cancellations Reduce by 20%
Projected Profit (Cancel -20%) =
[Total Profit] + [Cancelled Loss] * 0.20🎯 Strategic Recommendations
1 Reduce Returns
- Improve product quality controls
- Provide accurate size charts
- Use high-quality product images
- Improve product descriptions
2 Reduce Cancellations
- Ensure faster delivery timelines
- Improve stock availability & tracking
- Optimise order processing systems
- Enhance customer support
3 Focus on High-Profit Categories
- Scale the successful "Set" category
- Increase marketing & promotions
- Cross-sell & upsell strategies
- Introduce new product variations
4 Optimise Fulfilment
- Shift more orders to Amazon FBA
- Leverage Amazon Prime benefits
- Reduce merchant-fulfilled orders
- Improve delivery performance
📈 Impact Estimation
+₹0.25M
If Returns Reduce by 20%
New Profit: ₹26.1M
+₹1.38M
If Cancellations Reduce by 20%
New Profit: ₹27.3M
+₹0.94M
If Both Improve (20% + 10%)
New Profit: ₹26.7M
🛠️ Tools & Tech Stack
- SQL — Data extraction, aggregation, order cohort analysis
- Python (Pandas, Matplotlib, Seaborn) — EDA, trend analysis, visualisation
- Power BI — 4-page interactive dashboard with slicers & drill-throughs
- DAX — Custom KPIs, profit simulation measures, profit bridge
- Dataset — Amazon India e-commerce orders (Apr–Jun 2022)
📚 Full Project Resources