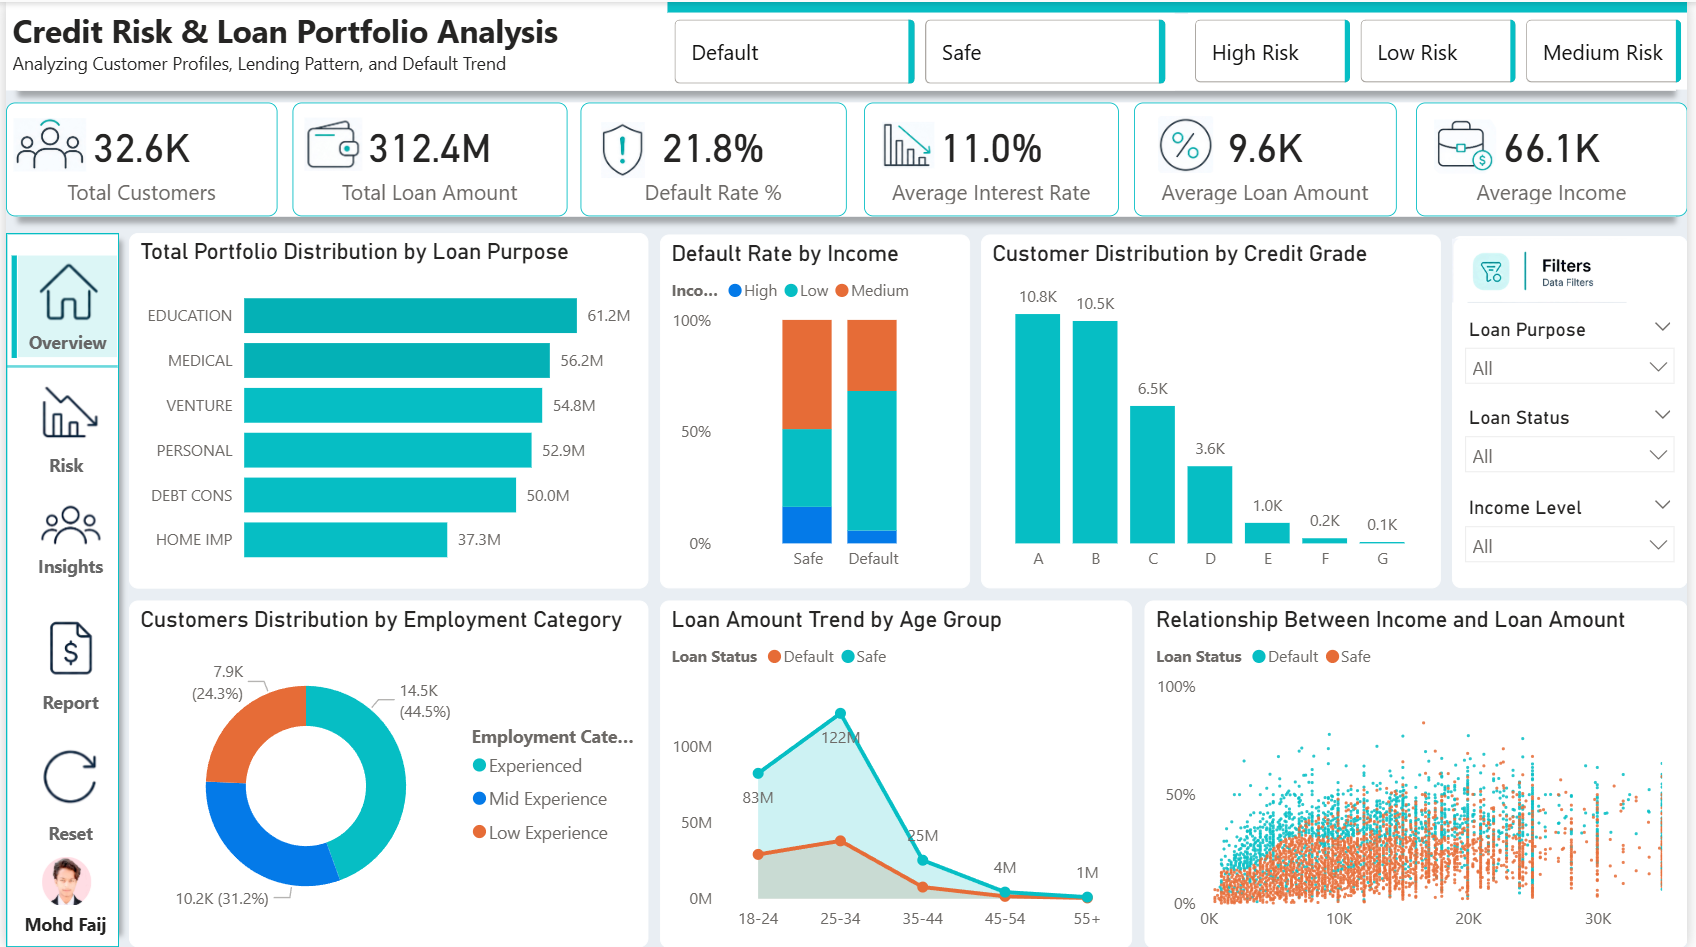
🏦 Credit Risk & Loan Portfolio Analysis
Total Customers
Total Loan Amount
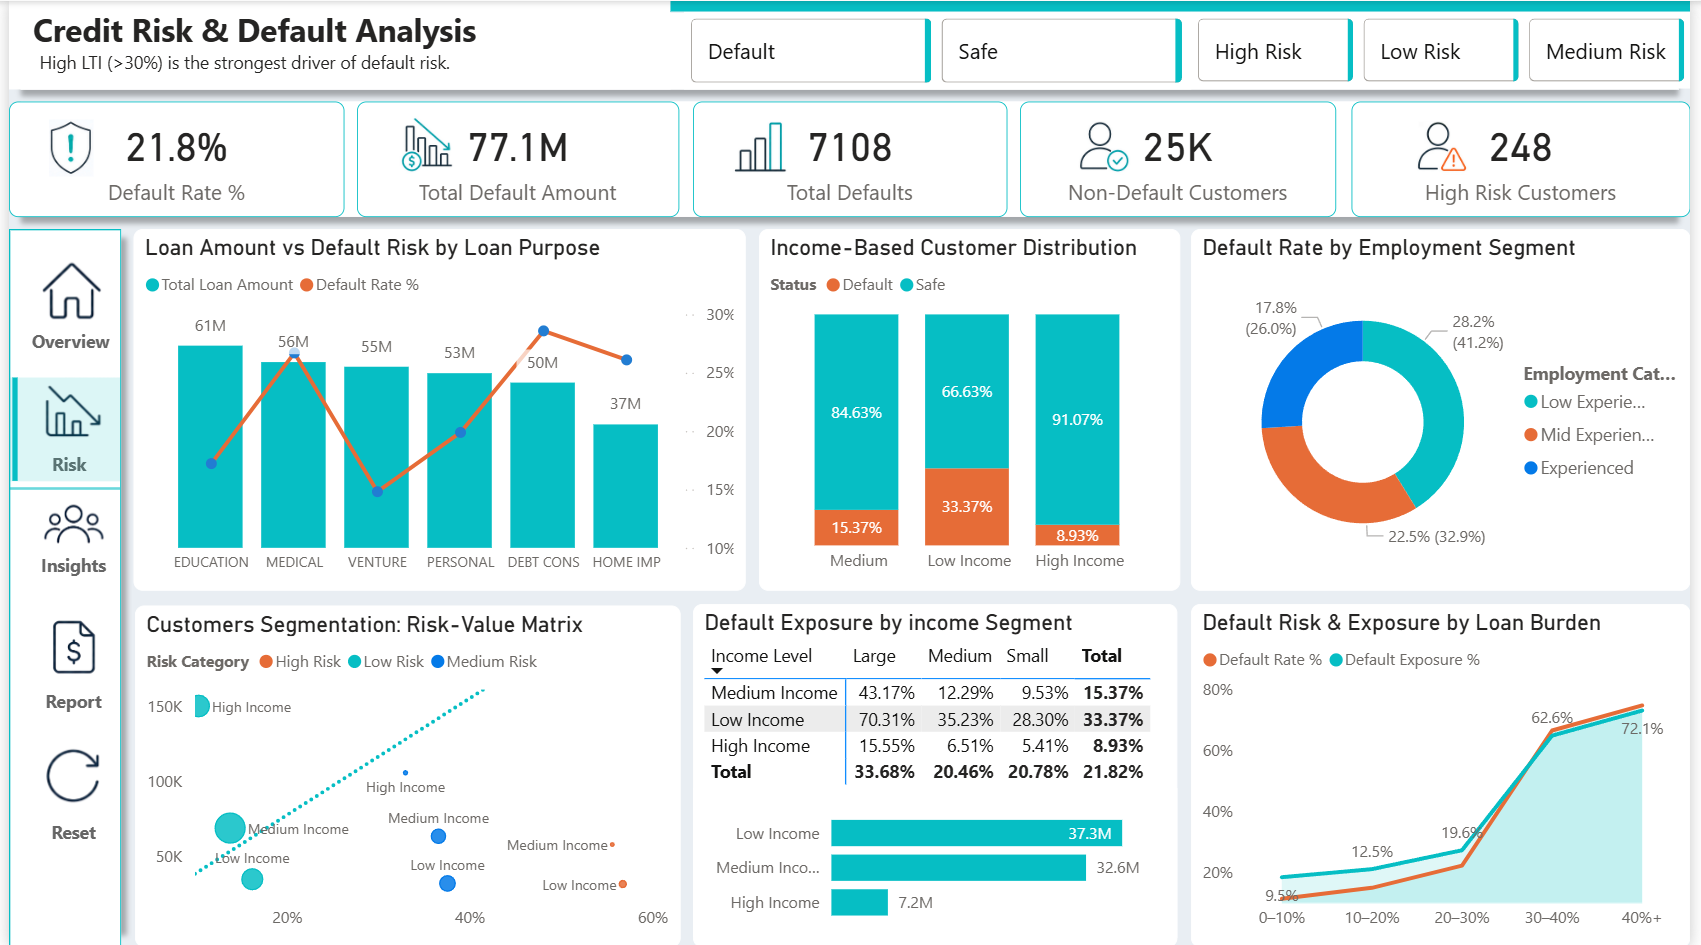
Overall Default Rate
Total Default Amount
High-Risk Customers
Avg Loan-to-Income
The Insight That Changed Everything
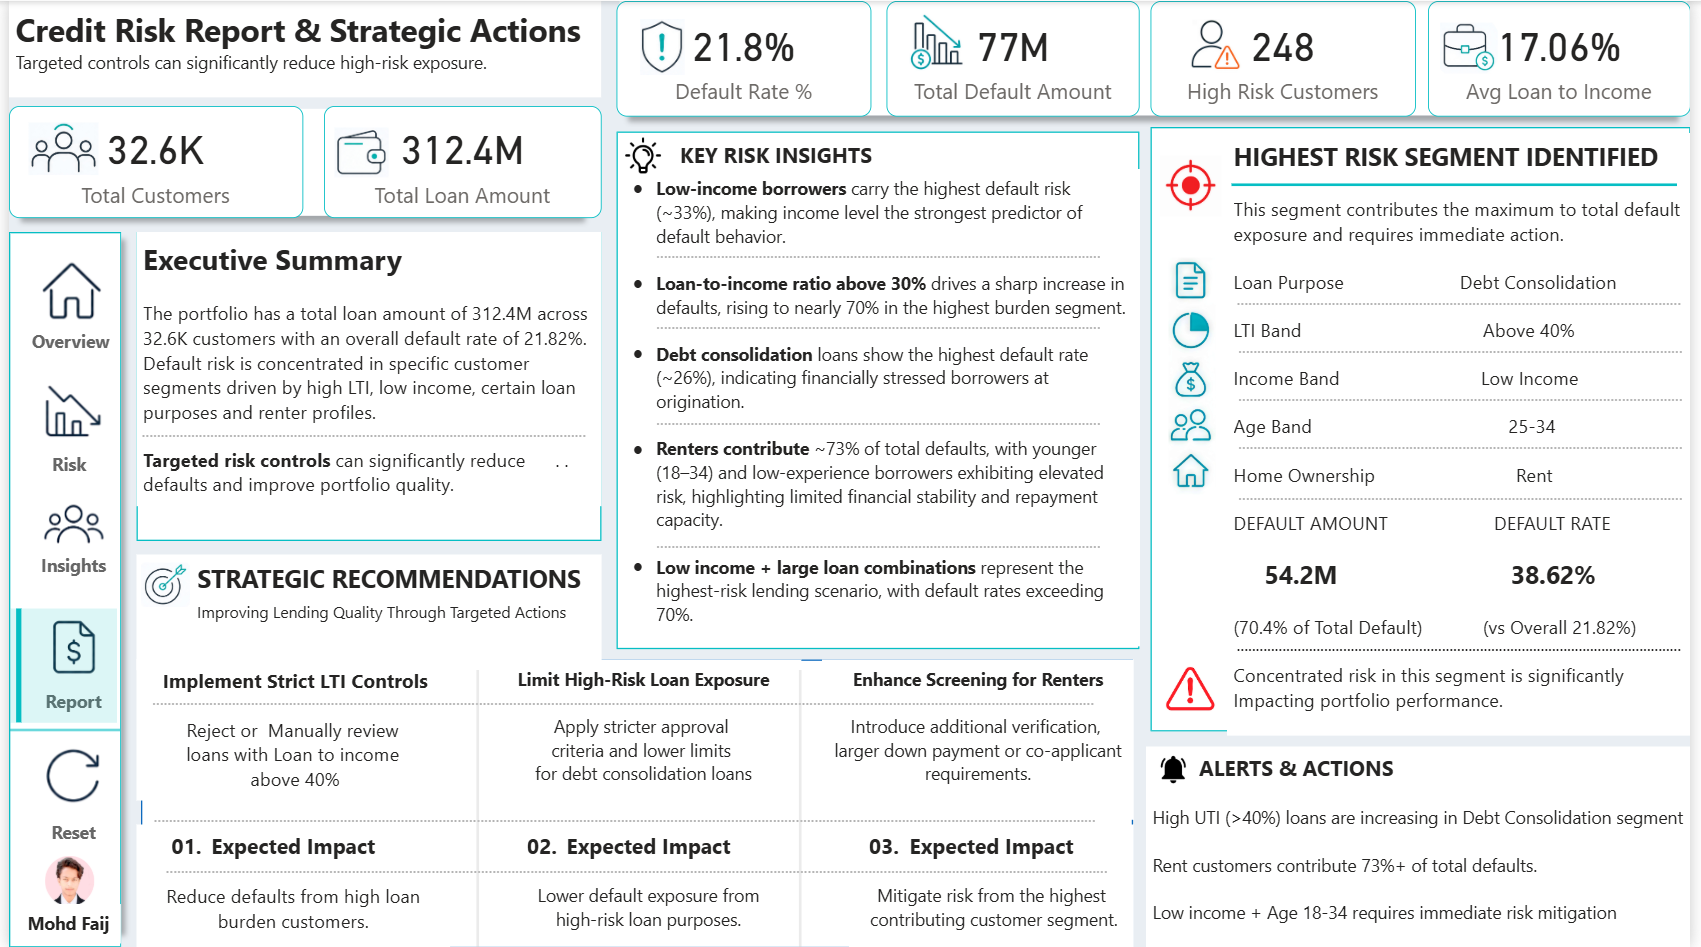
The analysis revealed that low-income borrowers taking large loans create a compounding risk — a default rate exceeding 70% in that single segment alone. Yet this group was being approved at nearly the same rate as safer segments.
The risk wasn't just high LTI or low income in isolation — it was their intersection. Identifying this compound risk profile became the foundation for every strategic recommendation in the report.
This segment contributes the maximum to total default exposure
- Low-income borrowers: ~33% default rate — income level is the single strongest predictor of default
- LTI above 30% drives sharp default spike — rising to nearly 70% in the highest burden segment
- Debt Consolidation: ~26% default rate — highest of any loan purpose, signals financially stressed borrowers
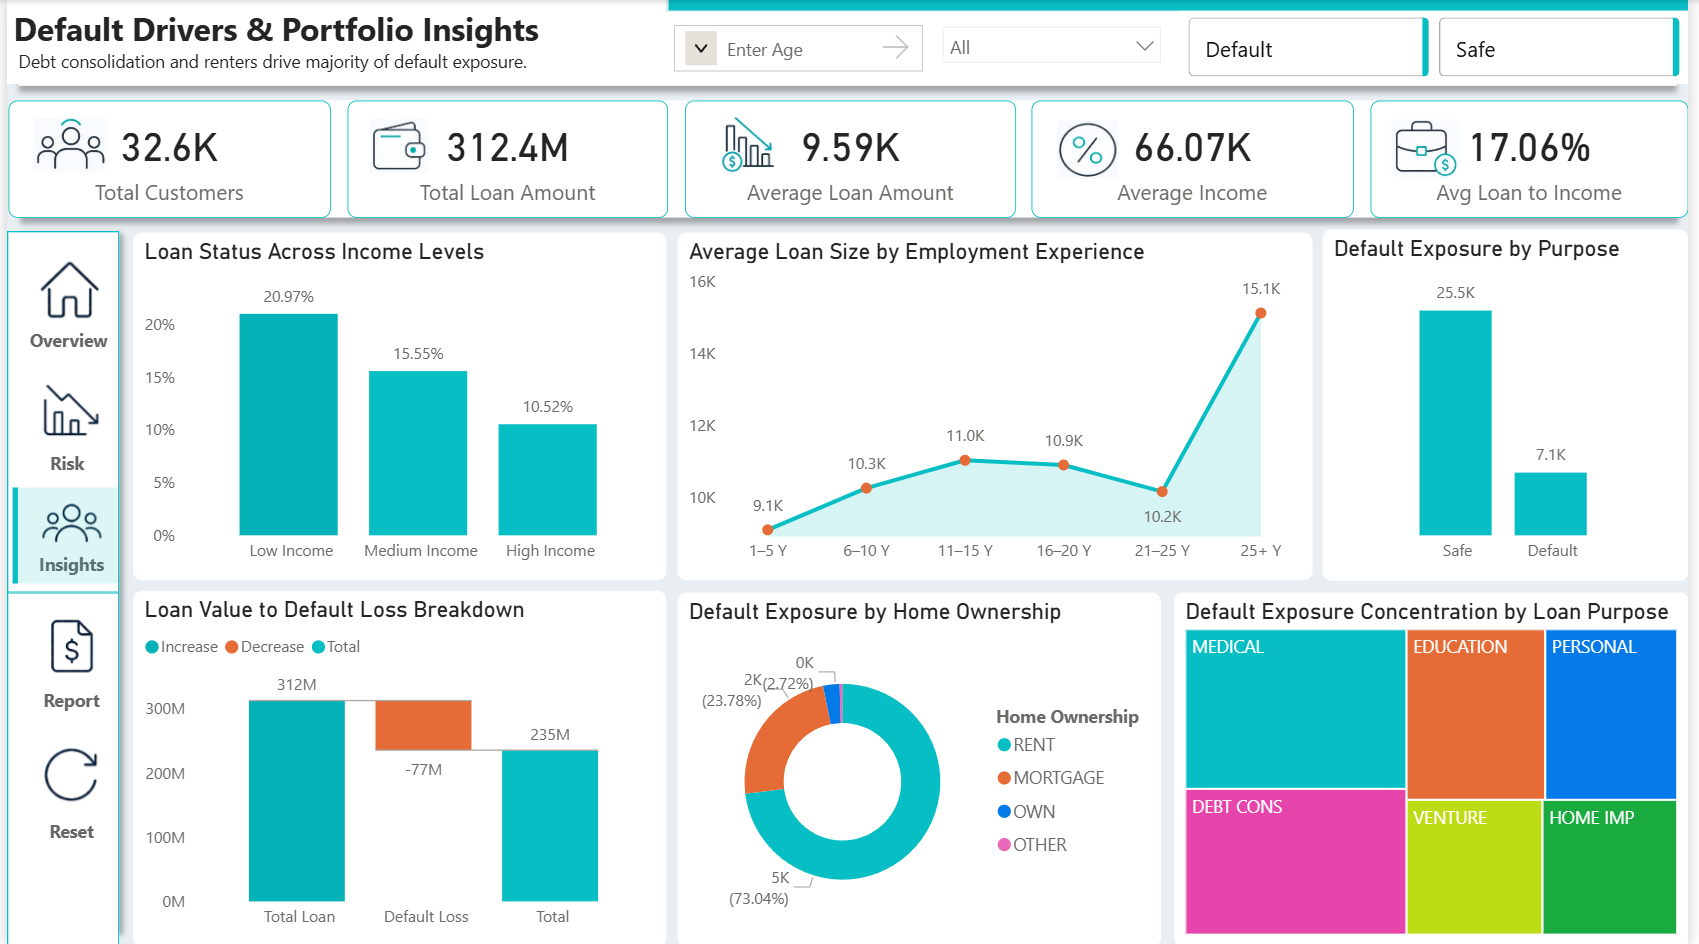
- Renters = 73% of total defaults — younger (18–34) + low-experience profile amplifies risk further
- Low Income + Large Loan = 70%+ default rate — the most dangerous lending combination
- Portfolio loss bridge: ₹312M total loans → -₹77M default loss → ₹235M performing value
- Experienced borrowers (25+ yrs) take larger loans (₹15.1K avg) but with far better repayment history
Live Alerts & Early Warning Signals
- High LTI (>40%) loans are increasing in the Debt Consolidation segment
- Rent customers now contribute 73%+ of total defaults — trending upward
- Low Income + Age 18–34 cohort requires immediate risk mitigation review
-- Default rate by income segment and loan burden
SELECT
    IncomeLevel,
    LTIBand,
    COUNT(*) AS TotalCustomers,
    SUM(CASE WHEN LoanStatus = 'Default' THEN 1 ELSE 0 END) AS Defaults,
    ROUND(
        SUM(CASE WHEN LoanStatus = 'Default' THEN 1.0 ELSE 0 END) / COUNT(*) * 100, 2
    ) AS DefaultRate,
    SUM(LoanAmount) AS TotalExposure
FROM LoanPortfolio
GROUP BY IncomeLevel, LTIBand
ORDER BY DefaultRate DESC;

-- Highest risk segment isolation
SELECT *
FROM LoanPortfolio
WHERE
    HomeOwnership = 'RENT'
    AND IncomeLevel   = 'Low'
    AND LoanPurpose   = 'Debt Consolidation'
    AND LTI           > 0.40
    AND Age BETWEEN 25 AND 34;
import pandas as pd
import seaborn as sns
import matplotlib.pyplot as plt

# Default rate heatmap – income vs LTI band
pivot = df.pivot_table(
    values='DefaultFlag',
    index='IncomeLevel',
    columns='LTIBand',
    aggfunc='mean'
) * 100

sns.heatmap(pivot, annot=True, fmt='.1f',
            cmap='RdYlGn_r', linewidths=0.5)
plt.title('Default Rate % – Income vs LTI Band')
plt.tight_layout()
plt.show()

# Portfolio loss bridge
categories = ['Total Loan', 'Default Loss', 'Net Value']
values     = [312, -77, 235]
colors     = ['#06BEC4', '#E66C37', '#06BEC4']
plt.bar(categories, values, color=colors)
plt.title('Portfolio Loss Bridge (₹M)')
plt.show()
// Default Rate %
Default Rate % =
DIVIDE(
    CALCULATE(COUNTROWS(Loans), Loans[Status] = "Default"),
    COUNTROWS(Loans)
) * 100

// Composite Risk Score per customer
Risk Score =
VAR LTIRisk    = IF(Loans[LTI] > 0.40, 0.35, IF(Loans[LTI] > 0.30, 0.20, 0))
VAR IncomeRisk = IF(Loans[IncomeLevel] = "Low", 0.30, IF(Loans[IncomeLevel] = "Medium", 0.15, 0))
VAR TenureRisk = IF(Loans[EmpYears] <= 5, 0.20, 0)
VAR OwnerRisk  = IF(Loans[HomeOwnership] = "RENT", 0.15, 0)
RETURN
    LTIRisk + IncomeRisk + TenureRisk + OwnerRisk

// Default Exposure % of Total
Default Exposure % =
DIVIDE(
    CALCULATE(SUM(Loans[LoanAmount]), Loans[Status] = "Default"),
    SUM(Loans[LoanAmount])
) * 100
1 Implement Strict LTI Controls
Reject or manually review all loans with Loan-to-Income ratio above 40%. Cap approval at LTI 30% for low-income applicants.
Reduce high-burden defaults2 Limit High-Risk Loan Exposure
Apply stricter approval criteria and lower limits for Debt Consolidation loans, especially for renters under 35.
Lower purpose-driven exposure3 Enhanced Screening for Renters
Introduce additional verification, larger down payment requirements, or co-applicant mandates for the rent + low-income profile.
Mitigate highest-risk segment- SQL — Data prep, segment isolation, cohort default analysis
- Python (Pandas, Seaborn, Matplotlib) — EDA, risk heatmaps, loss bridge visualisation
- Power BI — 4-page interactive dashboard with bookmarks, slicers & drill-through
- DAX — Risk score, default rate, LTI band measures, exposure % KPIs
- Dataset — Loan portfolio with 32.6K customer records across income, purpose & ownership attributes